
Korean
Insurance Market
Insurance Regulatory Changes in 2025
Increase in Coverage Limits for Gas Accident Liability Insurance
Gas accident liability insurance is a mandatory insurance policy designed to compensate for damage to a third party’s life, body, or property caused by a gas accident¹. To ensure that victims receive adequate compensation in the event of death or injury resulting from a gas-related incident, the coverage limits have been increased.
Gas Accident Liability Insurance Coverage Limits

(Sources: Korea Life Insurance Association, General Insurance Association of Korea, Dec. 30, 2024)
Increase in Coverage Limits for Children's Playground Liability Insurance
Children's playground liability insurance is a mandatory policy designed to compensate for damage to a third party’s life, body, or property resulting from the use of playground equipment at designated facilities. To ensure that victims receive adequate compensation in the event of death or injury at locations such as daycare centers and kindergartens, the coverage limits have been increased. Additionally, the scope of mandatory insurance coverage has been expanded. Previously, the policy applied to 20 types of facilities, including daycare centers, kindergartens, and child welfare facilities. With this revision, four additional facility types—science museums, arboretums and gardens, public sewage treatment facilities, and amusement parks—have been added to the list of facilities subject to the mandatory insurance requirements.
Children's Playground Liability Insurance Coverage Limits

(Sources: Korea Life Insurance Association, General Insurance Association of Korea, Dec. 30, 2024)
Group Insurance Beneficiary Change for Non-Work-Related Accidental Death
In group insurance policies, the beneficiary for non-work-related death has been changed from the company to the employee’s legal heirs to better protect workers' interests. This revision aligns with a Supreme Court ruling, which held that even when a group insurance contract designates the group or its representative as the beneficiary, the payout for non-work-related accidental death should belong to the employee.
Beneficiary Change

*The company (organization) to which the employee belongs
(Sources: Korea Life Insurance Association, General Insurance Association of Korea, Dec. 30, 2024)
Expansion of the Anti-Insurance Fraud System
With the amendment and enforcement of the Special Act on the Prevention of Insurance Fraud (August 2024), penalties now extend beyond the act of insurance fraud to include brokerage, inducement, solicitation, and advertising of fraudulent activities related to insurance. In response, the operational guidelines to reward insurance crime reporting were revised in December 2024 and came into effect on January 1, 2025, introducing a KRW 1 million reward for reporting such activities. In fact, the non-life insurance industry had already implemented a reporting reward system for violations related to the prohibition of brokerage, inducement, solicitation, and advertising of insurance fraud as of August 14, 2024.
Preliminary Business Results of Insurers in Korea for Q1-Q3 2024
From January to September 2024, gross written premiums of all insurers in Korea (22 life insurers and 31 non-life insurers) amounted to KRW 170.09 trillion, an increase of KRW 7.78 trillion (+4.8%) compared to the same period of the previous year.
During this period, gross written premiums for life insurers amounted to KRW 80.83 trillion, reflecting a year-on-year increase of KRW 4.37 trillion (+5.7%). This growth was driven by higher sales of protection-type insurance (+13.0%) and savings-type insurance (+4.6%), which offset declines in variable insurance (-0.5%) and retirement annuities (-13.2%).
Gross written premiums for non-life insurers totaled KRW 89.26 trillion, up KRW 3.41 trillion (+4.0%) from the same period of the previous year. While motor insurance experienced a decline in premiums (-1.4%), overall growth was supported by increased sales in long-term insurance (+5.2%), general P&C (+8.1%), and retirement annuity (+2.2%).
Premium Income
(Unit: KRW billion)

* Based on direct premiums
(Source: Financial Supervisory Service, Nov. 26, 2024)
For the first three quarters of 2024, the net income of all insurers amounted to KRW 13.40 trillion, an increase of KRW 1.56 trillion (+13.2%) compared to the same period of the previous year. The net income of life insurers was KRW 5.31 trillion, up KRW 595.6 billion (+12.6%) year on year. This increase was driven by improvements in underwriting profit, supported by the expansion of insurance product sales, and investment profit, driven by higher investment returns, including interest and dividend income. The net income of non-life insurers was KRW 8.09 trillion, an increase of KRW 966.8 billion (+13.6%) year on year. The rise was attributed to improvements in underwriting profit, led by the expansion of long-term insurance sales, as well as growth in investment profit, supported by higher interest income and valuation gains on financial assets.
Net Income
(Unit: KRW billion)
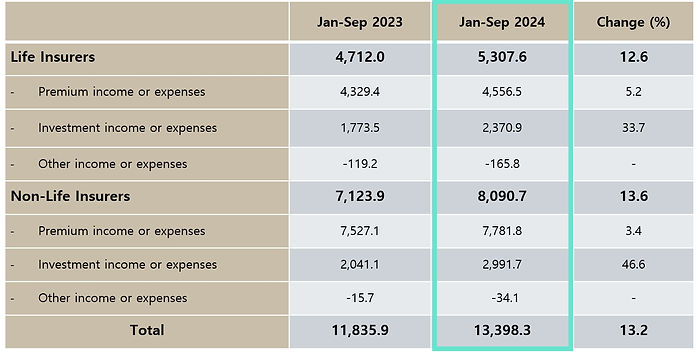
(Source: Financial Supervisory Service, Nov. 26, 2024)
From January to September 2024, the return on assets (ROA) stood at 1.44%, increasing by 0.07%p compared to the same period of the previous year. The return on equity (ROE) was 11.35%, up 2.08%p year on year.
ROA and ROE
(Unit: %)

(Source: Financial Supervisory Service, Nov. 26, 2024)
As of the end of September 2024, total assets and total liabilities of insurers stood at KRW 1,257.0 trillion and KRW 1,110.3 trillion, respectively, increasing by KRW 30.7 trillion (+2.5%) and KRW 52.2 trillion (+4.9%) compared to the end of December 2023. Meanwhile, shareholders’ equity declined to KRW 146.7 trillion, down KRW 21.5 trillion (-12.8%) from the end of December 2023, as the growth in total liabilities outpaced that of total assets.
Total Assets and Shareholders’ Equity
(Unit: KRW trillion)
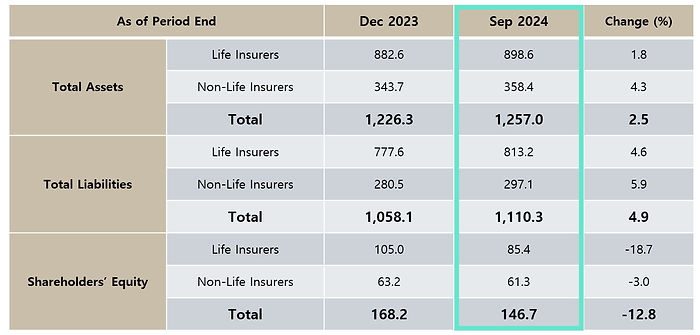
(Source: Financial Supervisory Service, Nov. 26, 2024)
In summary, from January to September 2024, the net income of insurers increased compared to the same period of the previous year, driven by improvements in both underwriting and investment profitability. However, total liabilities increased due to declining interest rates and regulatory changes resulting in a lower discount rate for insurance liabilities, which in turn led to a decline in shareholders' equity. With ongoing risks in domestic real estate project financing (PF) and overseas commercial real estate markets, concerns remain over heightened financial market uncertainty. In response, insurers must take proactive measures to manage their financial soundness. Accordingly, financial supervisory authorities have announced plans to closely monitor insurers' profitability and financial stability and implement preemptive measures to mitigate potential risks in the sector.
K-ICS Ratios of the Korean Insurance Industry as of September 2024
As of the end of September 2024, the Korean Insurance Capital Standard (K-ICS) ratio of all insurers, after applying transitional measures, stood at 218.3%, increasing by 1.0%p from the previous quarter (217.3%). Life insurers recorded an average K-ICS ratio of 211.7%, reflecting a 0.9%p decline, while non-life insurers reported 227.1%, showing a quarter-on-quarter increase of 3.1%p.
K-ICS Ratios of Insurers in Korea (2021-2024)
(Unit: %)

*The 2024 ratios refer to K-ICS ratios after the application of transitional measures.
(Source: Financial Supervisory Service, Press Release on Jan. 14, 2025)
The primary factors behind the change in the K-ICS ratio were a decline in available capital (KRW -1.5 trillion) due to falling stock prices and lower market interest rates, alongside a decrease in required capital (KRW -1.2 trillion) driven by the impact of declining stock prices.
As of the end of September 2024, after applying transitional measures, available capital under the K-ICS framework stood at KRW 258.9 trillion, reflecting a KRW 1.5 trillion decrease from the previous quarter. This decline was primarily due to an KRW 11.2 trillion reduction in accumulated other comprehensive income, driven by falling stock prices and lower market interest rates, which led to an increase in insurance liabilities. While retained earnings increased by KRW 5.7 trillion and KRW 3.4 trillion worth of capital securities (including hybrid and subordinated bonds) were issued, these factors only partially offset the decline. In fact, the yield on 10-year government bonds fell from 3.27% at the end of June 2024 to 2.99% (-27bp) at the end of September 2024.
As of the end of September 2024, after applying transitional measures, required capital under K-ICS decreased by KRW 1.2 trillion to KRW 118.6 trillion. This decline was primarily driven by a KRW 3.9 trillion reduction in equity risk exposure, resulting from falling stock prices. While disability and disease risk capital increased by KRW 1.9 trillion due to expanded health insurance sales, and interest rate risk capital rose by KRW 0.7 trillion due to lower market interest rates, these increases were outweighed by the significant decline in equity risk capital.
K-ICS Ratios and Impacts from Transitional Measures (as of September 2024)

(Source: Financial Supervisory Service, Insurance Companies’ Capital Adequacy Ratios under K-ICS, September 2024, Press Release dated Jan. 14, 2025)
The K-ICS ratio of insurers remained at a stable level of 218.3%, demonstrating the robust solvency of the insurance industry in Korea. The ratios are regularly monitored by the FSS, which is responsible for identifying solvency issues of insurers at an early stage and intervening effectively in order to minimize losses to policyholders. In case of any signs of deterioration in the ratio, the financially weakening insurer will be guided to take proactive actions such as more rigorous stress testing and capital raising.
Utilization of Retirement Pension Reserves for Purchasing Protection-Type Insurance Products
Rapid population aging and increased life expectancy are expected to heighten longevity risk at both the societal and individual levels. As of July 2024, Korea's population aged 65 and older exceeded 10 million, with an aging rate of 19.2%. By 2025, the proportion of elderly individuals is projected to surpass 20%, marking Korea's entry into a super-aged society. At the same time, the working-age population continues to decline and is expected to fall below the elderly population by around 2065. Additionally, Korea recorded a total fertility rate of 0.72 in 2023 - the lowest in the world.
The growing elderly population and rising life expectancy underscore the need for enhanced retirement planning. However, the simultaneous decline in the working-age population and falling fertility rate are expected to weaken societal preparedness for aging, significantly exacerbating longevity risk. This risk may manifest in two ways:
-
Health risk: rising healthcare costs may leave individuals without sufficient medical funds;
-
Income risk: longer life expectancy may lead to a shortfall in retirement income, as savings and pensions may not last through extended retirement years.
Aging Trends

(Source: Korea Insurance Research Institute, Nov. 2024)
The National Pension System, established to ensure retirement income security, is increasingly viewed as a key measure to address longevity risk. However, concerns over the depletion of pension funds have become a serious issue. As of the end of April 2024, the National Pension Fund's reserves stood at approximately KRW 1,100 trillion.
As a result, there is growing emphasis on utilizing retirement pensions, private pensions, and even reverse mortgages (home pensions) to strengthen retirement income security. However, the private pension market faces significant challenges, including coverage gaps and low returns, which hinder its expansion. On a positive note, retirement pension reserves surpassed KRW 400 trillion in the first half of 2024, and when including severance pay, total retirement assets are significantly higher. Notably, retirement pension reserves are expected to exceed National Pension Fund reserves by around 2050, positioning them as the most substantial and reliable retirement asset fund in the future.
At the end of 2023, Korea’s retirement pension reserves amounted to KRW 382.4 trillion, maintaining an average annual double-digit growth rate. This marks a twofold increase compared to 2018. By the first half of 2024, reserves had already surpassed KRW 400 trillion, reinforcing expectations that retirement pensions will play a greater role in retirement income security. However, concerns persist regarding low returns, as the annual return rate has remained around 2%. The five- and ten-year annualized returns, after deducting total costs, were recorded at 2.35% and 2.07%, respectively – significantly lower than the National Pension Fund’s annualized return of 5-6% over the same period.
The persistently low returns on retirement pensions are often attributed to the heavy reliance on principal-protected products in asset management. From 2015 to 2023, returns on these products ranged from 1.35% in 2021 to 4.08% in 2023, while investment-linked products saw far greater volatility, with returns fluctuating between -14.2% in 2022 and 13.27% in 2023. Despite an average return of around 2%, investment-linked products have shown extreme volatility, making profit stability difficult to achieve.
Managing retirement pension assets effectively is a critical task in enhancing their value as a retirement income source. The government has made significant policy efforts to improve investment returns on retirement pensions, but challenges persist due to market instability, excessive short-term investment strategies, and structural issues in the financial markets. Even two decades after its introduction, more than 85% of retirement pension reserves are still invested in principal-protected products, highlighting the difficulty in diversifying investment strategies.
Currently, the principal-protected products in retirement pensions primarily include bank deposits and savings accounts in the banking sector, equity-linked bonds (ELBs) in the securities sector, and guaranteed investment contracts (GICs) in the insurance sector. However, in the insurance sector, only savings-type insurance is included, while protection-type insurance, which serves as a retirement income security measure, is excluded (Article 8-3 of the retirement pension supervision regulation). This exclusion does not stem from an absolute regulatory principle but rather from a policy decision made following the amendment of the retirement pension supervision regulation in December 2012.
Changes in Allocation Limits for In-House Principal-Protected Products and Inclusion of Protection-Type Insurance

(Source: Korea Insurance Research Institute, Nov. 2024)
To strengthen the retirement pension system and enhance retirement income security, we examined international cases where protection-type insurance products are incorporated into retirement pension reserves as a management strategy.
The United States, Japan, and Australia each incorporate protection-type insurance products into retirement pension management, albeit through different approaches. In the United States, Defined Benefit (DB) pension plans allow retirees to allocate up to 25% of their pension funds to a Medical Savings Account (401(h)), enabling them to purchase health insurance or life insurance, thereby reducing post-retirement medical expenses. Japan’s Defined Contribution (DC) pension plans offer funded accident insurance with death benefits, allowing pension holders to prepare for disability or death risks,
thus enhancing retirement income stability. In Australia, MySuper scheme mandates that retirement pension providers offer protection-type insurance in the form of group insurance, ensuring that all pension plan members automatically receive death and total permanent disability (TPD) insurance without requiring separate enrollment procedures.
Protection-Type Insurance in Retirement Pensions by Country

(Source: Korea Insurance Research Institute, Nov. 2024)
In Korea, where principal protection is a top priority, expanding the scope of asset management options within principal-protected products to include not only savings-type insurance but also protection-type insurance could help reduce policy cancellations related to retirement planning. This approach is expected to strengthen retirement preparedness by allowing individuals to enhance their financial security before retirement.
Additionally, from the perspective of strengthening the retirement pension system and enhancing the efficiency of principal-protected product management, including protection-type insurance within principal-protected products could help improve potential returns. While concerns exist that policyholders who do not file insurance claims may see their accumulated funds eroded, such products provide psychological security throughout the policy period. To address concerns over the depletion of reserves, reasonable limitations could be set, such as excluding low-asset individuals from participation or capping allocations at 10% of total reserves. Furthermore, incorporating protection-type insurance could ensure that medical expenses in the event of an accident are covered through insurance payouts rather than depleting pension reserves. This could help reduce early withdrawals from retirement savings for medical or long-term care expenses, which are among the primary reasons for early withdrawals.
Gradually incorporating protection-type insurance into retirement pension management would allow retirement pensions to function as a comprehensive financial asset, supporting not only post-retirement living but also disability coverage, survivor benefits, and medical expense protection. This approach would enhance the role of retirement pensions in providing comprehensive financial security throughout an individual's life.
Insurance Company CEO Survey
The Insurance Company CEO Survey, conducted by the Korea Insurance Research Institute (KIRI), was first introduced in 2020 in response to growing uncertainty in the insurance business environment due to the COVID-19 pandemic. The 2024 survey marks its fifth year, with 34 out of 44 insurance company CEOs participating. There were 18 participants from life insurers and 16 from non-life insurers, representing 87% of total industry assets and 85% of total premiums.
The survey covers four key areas: economic environment, management indicator forecasts, insurance industry assessment, and management strategy formulation. Most questions are short-answer or scale-based, while ranking questions are analyzed by assigning weighted scores based on their rank.
(1) Economic Outlook
The 2024 survey results show that insurance company CEOs expect Korea's economy in 2025 to be slightly worse (52.9%), similar (26.5%), or slightly improved (20.6%) compared to 2024, with more than half of them predicting a slight downturn. The key risks delaying economic recovery were identified as political uncertainty in major economies and rising household debt.
Most CEOs expected monetary tightening in Korea to ease from 2024 onward, with 76.5% of respondents forecasting that long-term interest rates (10-year government bonds) will decline to 2.5–3.0% by the end of 2025, while 17.6% anticipated a significant drop below 2.5%. Overall, 94.1% of respondents expected interest rates to decline.
(2) Management Indicator Forecast
Following the transition to new accounting standards, most insurance companies expect profitability to improve due to the stable accumulation of the Contractual Service Margin (CSM). However, some insurers still express significant concerns over profitability declines. While 82.4% of respondents expected net income to increase in 2024, 88.2% expected an increase in 2025.
Regarding capital adequacy, 79% of insurance companies plan to maintain their K-ICS ratio (after transitional measures) within the 151–250% range in 2025, reflecting a slightly lower target level compared to last year’s survey.
(3) Insurance Industry Assessment
Insurance company CEOs generally perceive consumer trust in the insurance industry as moderate (52.9%) or low (44.1%), indicating an overall low level of trust. The key factors influencing consumer trust include insurance product sales practices (35.3%), claims payment practices (21.1%), consumer understanding of insurance (18.6%), complaint handling practices (7.8%), and insurance fraud (7.4%).
The level of innovation in the insurance industry was generally rated as low (50%) or moderate (44.1%), indicating an overall low perception of innovation. Key factors hindering innovation were primarily related to market and regulatory conditions, with responses citing sales-driven competition in the domestic market (33.3%), regulatory constraints limiting business autonomy (31.8%), and uncertainty in revenue generation (16.9%) as major obstacles.
The most effective measures to enhance trust in financial information within the insurance industry were identified as establishing practical standards for estimations (24.5%), refining supervisory reporting and market disclosures (16.5%), and improving engagement with the market (14.0%).
(4) Management Strategy Formulation
When formulating management strategies, CEOs prioritized enhancing distribution channel competitiveness (30%) and developing new products (24%), indicating that intense competition for profitability in the insurance market is expected to continue in the near term.
Life insurance company CEOs indicated that over the next one to two years, they will primarily focus on selling protection-type insurance, with health insurance (40%) and whole life insurance (32%) being the main areas of emphasis. Non-life insurance company CEOs selected long-term personal insurance (46%) as their core product, similar to previous years, while also showing strong interest in general non-life insurance products (33%).
Insurance company CEOs indicated that their 2025 asset management strategy will focus on reducing market risk and increasing the proportion of liquid assets in response to heightened economic and financial uncertainty.
Similar to previous surveys, health-related business areas ranked highest among new business opportunities, with health management services (28%) and long-term care and nursing services (28%) receiving the most attention. However, there was relatively low interest in pursuing long-term business model transformation as part of new business initiatives.
(5) Summary
According to the survey results, competition in the health insurance market between life and non-life insurers is expected to remain intense in 2025. CEOs also recognize the need to prepare for unfavorable economic, financial, and regulatory conditions affecting the industry. Although insurers seem to prioritize insurance sales over long-term business model transformation, it is becoming increasingly important for insurers to shift away from sales-driven competition and focus on establishing a long-term growth foundation through business model transformation.
Analysis of Engineering Insurance Losses over the Past 10 Years
(1) Analysis of Incurred Losses
Over the past 10 years (2014–2023), the average number of accidents for engineering insurance (CAR, EAR, CMI) was 1,116 per year, showing a gradual increase over time. The highest number of accidents was recorded in 2023, with 1,516 cases, while the lowest was in 2015, with 749 cases. The average annual total loss amount over the same period was KRW 134.5 billion, with the highest loss recorded in 2020 at KRW 261.2 billion and the lowest in 2021 at KRW 66.6 billion. The average total loss per accident over the 10-year period was KRW 121 million, with the highest in 2020 at KRW 189 million per accident and the lowest in 2021 at KRW 62 million per accident. These figures are based on contracts written by Korean Re.
Engineering Insurance Total Losses and Number of Accidents

By sub-line of business, Contractors' All Risks (CAR) insurance recorded an average of 854 accidents per year over the past 10 years, while the recent four-year period (2020–2023) saw an increase to an average of 911 accidents per year. The 10-year average total loss amount for CAR insurance was KRW 89.3 billion, rising to KRW 102.4 billion in the most recent four years. The years 2018–2020 and 2022 experienced a surge in accidents due to typhoons and heavy rainfall, with an average of 960 accidents and total losses reaching KRW 129.4 billion during these periods.
Erection All Risks (EAR) insurance recorded an average of 95 accidents per year over the past 10 years, increasing to 115 accidents per year in the most recent four years. The 10-year average total losses for EAR insurance were KRW 27.9 billion, with the recent four-year period recording KRW 27.7 billion. Additionally, large insured losses exceeding KRW 10 billion occurred in 2015 (KRW 22 billion, 1 case), 2016 (KRW 32 billion, 1 case), and 2018 (KRW 29 billion, 1 case).
Contractors' Machinery Insurance (CMI) recorded an average of 168 accidents per year over the past 10 years, rising significantly to 320 accidents per year in the most recent four years. The 10-year average total losses for CMI insurance were KRW 17.2 billion, increasing to KRW 33.4 billion in the recent four-year period. Additionally, large insured losses exceeding KRW 10 billion occurred in 2022 (KRW 22.5 billion, 1 case) and 2023 (KRW 10.8 billion, 1 case).
Trends in Total Losses by Line of Business
(Unit: KRW billion)

For large insured losses exceeding KRW 2 billion, the average number of accidents over the past 10 years was 11.0 cases per year, accounting for 1.0% of total accidents, while the total losses from these cases amounted to KRW 64.7 billion, representing 48.1% of total losses. In the recent four years, the average proportion of total losses attributed to large accidents increased to 52.1%, indicating a rising share of high-value loss events.
Over the past 10 years, for large insured losses exceeding KRW 2 billion, the average number of accidents and total losses by sub-line of business were as follows: CAR recorded 6.6 cases per year, with total losses of KRW 38.5 billion (43.1%); EAR recorded 3.0 cases per year, with total losses of KRW 18.6 billion (66.8%); and CMI recorded 1.4 cases per year, with total losses of KRW 7.5 billion. In the recent four years, the proportion of total losses from large accidents increased by 8.0%p for CAR and 3.8%p for CMI, while EAR decreased by 5.5%p.
The primary causes of large insured losses vary by sub-line of business. For CAR, large-scale losses are mainly attributed to natural disasters, while catastrophic losses exceeding KRW 10 billion have primarily resulted from ground subsidence or construction site fires. In EAR, large insured losses are typically caused by fires or explosions, with all three cases of catastrophic losses exceeding KRW 10 billion occurring at power plants. For CMI, major losses are primarily linked to electrical failures in Energy Storage Systems (ESS) and wind power facilities, with both catastrophic losses exceeding KRW 10 billion occurring at ESS facilities.
Trends of Large Insured Losses Exceeding KRW 2 Billion
(Unit: KRW billion)

(2) Case Analysis of Accidents
An analysis of accident cases by industry sector, based on the number of accidents, shows that in CAR, losses were most frequently reported in general construction (42.7%), followed by road projects (21.7%), railway construction (15.2%), and river projects (13.2%). In EAR, the highest proportion of losses occurred in the power industry (67.0%), followed by metal machinery and equipment manufacturing (14.0%), and the petrochemical industry (6.5%).
Analysis by Industry
(Unit: %)

An analysis of accidents exceeding KRW 100 million, based on the number of accidents by type, shows that in CAR, the most frequent causes of loss were natural disasters (32.2%), physical damage (22.8%), and insured's negligence (15.3%). In EAR, losses were most commonly attributed to physical damage (39.0%), followed by natural disasters (17.5%), and fire (11.5%).
Analysis by Accident Type
(Unit: %)

(3) Power Plant Accident Analysis
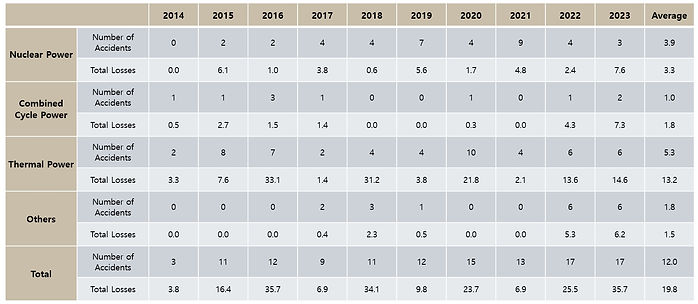
The table below presents an analysis of power plant accidents exceeding KRW 100 million. Over the past 10 years, the average number of accidents per year was 12 cases, with an annual average total loss of KRW 19.8 billion.
The proportion of accidents by power plant type was nuclear power (32.5%), combined cycle power (8.3%), thermal power (44.2%), and others (15.0%), while the proportion of total losses was nuclear power (16.8%), combined cycle power (9.0%), thermal power (66.8%), and others (7.4%). Nuclear and thermal power plants accounted for a significant share of both accident frequency and total losses, primarily due to their longer construction periods and complex equipment, which increase their exposure to accidents.
Number of Accidents and Total Losses by Power Plant Type
(Unit: KRW billion)
(4) Natural Disaster Accident Analysis
Over the past 10 years, the average total losses from natural disasters in CAR for accidents exceeding KRW 100 million were KRW 26.2 billion, accounting for 29.3% of the total average CAR losses (KRW 89.3 billion, including all accidents below KRW 100 million). In EAR, the average total losses from natural disasters for accidents exceeding KRW 100 million were KRW 5.1 billion, representing 18.3% of the total average EAR losses (KRW 27.9 billion, including all accidents below KRW 100 million).
For natural disaster accidents exceeding KRW 100 million, an analysis of total losses by peril over the past 10 years shows that in CAR, the average proportion of total losses was typhoons (61.4%), heavy rain (32.5%), cold damage (0.1%), and others (6.1%). In EAR, the average proportion of total losses was typhoons (33.8%), heavy rain (50.1%), and others (16.1%).
Breakdown of Losses by Peril Over the Past 10 Years (KRW 100 Million and Above)
(Unit: KRW billion)

(5) Seasonal Factors
The table below presents an analysis of monthly total losses over the past 10 years for accidents exceeding KRW 100 million.
The proportion of natural disaster losses relative to total losses is 32.6% for CAR and 18.9% for EAR, indicating that CAR has a higher share of losses attributed to natural disasters.
Both CAR and EAR experience the majority of natural disaster-related losses during the summer months. In CAR, 69.7% of accidents occurring between July and October were caused by natural disasters, while in EAR, 43.3% of accidents between July and September were attributed to natural disasters.
Monthly Total Losses over the Past 10 Years (KRW 100 Million and Above)
(Unit: KRW billion)

[1] Gas accidents include incidents caused by high-pressure gas, LPG, urban gas, and hydrogen